The isolation and characterization of subclasses of extracellular vesicles (EVs) has been an important goal of the field for many years. Measurements based on nanoparticle tracking analysis (NTA) (Dragovic et al, Nanomedicine 2011) and resistive pulse sensing (RPS) (Vogel et al, Anal Chem 2011) properties of these EVs are in common use in the field to measure various particle characteristics, including size and concentration. Flow cytometry is a well-developed technology that offers several unique advantages to characterize EVs, including high speed and quantitative analysis of individual cells or particles, with the added advantage of subsequent purification of discrete subsets of particles of interest. Our group has designed a robust flow cytometry-based technique capitalizing on recent improvements in light collection optics, electronic detectors, and computer sub-systems to develop FAVS (Fluorescence-Activated Vesicle Sorting). This technique requires at a minimum a modern digital sorter with highly efficient light collection optics. EVs need to be disaggregated into individual particles by shearing them sequentially through 22-, 27-, and 30-gauge syringes. Properly suspended EVs can then be stained, washed, and analyzed using sorter-optimized configurations. The sorter must be calibrated and set up so that the signals from the EVs are processed as fast as the electronics will allow, and the EVs must be diluted to no more than 10 μg/ml total protein to avoid swarm effects by which multiple particle events are measured together rather than individually (van der Pol et al J Thromb Haemost 2012). We have demonstrated the ability to purify vesicles below the diffraction limit of light to a post-sort purity of greater than 99% double-positive fluorescence and size range of 40 to 70 nm in diameter (Cao et al, Mol Cell Proteomics 2008). To achieve this result, we started with iodixanol gradient-enriched intracellular vesicles that averaged less than 70% double-positive fluorescence and a vesicle size range of 30-300 nm in diameter. We have gone on to use FAVS to analyze EVs in various contexts, including those secreted from cells in culture (Higginbotham et al, Curr Biol 2011 and Demory et al, Mol Cell Proteomics 2013) and to isolate specific subclasses of secreted vesicles in vivo (McConnell et al, J Cell Biol 2009 and Shifrin et al, Curr Biol 2012) to analyze their constituents. Other groups have employed similar strategies to measure secreted vesicles by flow methods (Nolte-‘t Hoen et al, J Leukoc Biol 2013 and Momen-Heravi et al, Front Physiol 2012). Strict adherence to the parameters described above and judicious gating can allow comparable results.
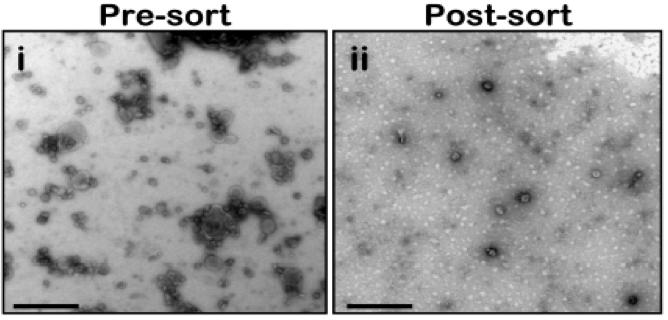
Negative-stain transmission electron micrograph (TEM) of vesicles present in sucrose gradient fraction 3. The considerable size variation observed before FAVS (i) is notably decreased after sorting (ii). Bars, 0.5 μm.

There are no comments.